If you tend to avoid venturing away from Excel’s home tab, where you feel most comfortable, you are missing out on some features that could make your life easier. The Excel 2016 Data Tab, for example, is packed with useful functionality. In this post, we will review the functionality available in the “Get & Transform,” “Queries & Connections,” and “Data Tools” sections of the Data Tab.

Get and Transform Data Using Queries & Connections
Buttons in the Get & Transform section of the Data Tab are used in conjunction with Queries and Connections to accomplish the following tasks:
- Get data from the following sources:
- File (i.e., Excel, CSV, XM, JSON, Folder, SharePoint Folder)
- Database (i.e., SQL Server, MS Access, MySQL, Oracle, and several others)
- Azure Cloud Services
- Online Services (i.e., SharePoint, MS Exchange, Dynamics 365, Facebook, Salesforce)
- Other Sources (i.e., Table/Range, Web URL, MS Query, SharePoint List, QData, Hadoop file, Active Directory, ODBC, OLEDB)
- Cleanse and Transform Data
Get Data
Excel provides prompts that guide the user through the process of getting data from a desired source. For example, when getting data, the user can “Load” the data, which will place it in a table on a new worksheet. Alternatively, the user can select “Load To” from the dropdown list, and select from several options for what do to with the data once it is retrieved – or once a connection to the source file is established.
To establish a data connection, select “Load To.” This will launch a pop-up that contains several radio buttons. For this example, we will select “Only Create Connection.”

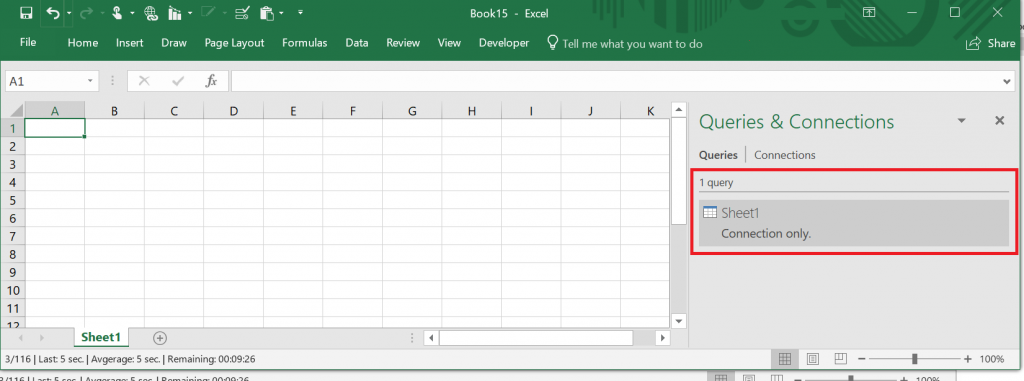
Once the connection is established, the “Queries and Connections” navigation pane appears to the right of the worksheet. Notice that no data appears in the worksheet, and the navigation pane indicates that Sheet 1 contains 1 query with “Connection Only.”

One of the more recent additions to Excel is the ability to add the data to the Data Model. When “Add this data to the Data Model” is selected, the data is pulled into Excel, where the calculation engine and advanced features can be leveraged to analyze data from the selected source – and any other sources that are included in the Data Model.

In the Queries and Connections navigation pane, when “Connections” is selected, the established connection is now shown as being part of the Data Model.

Cleanse and Transform Data
Excel 2016 provides an easy way for you to cleanse and transform the data prior to pulling it into your analysis. In the import procedure, simply select “Edit” instead of “Load” or “Load To,” and the Power Query Editor will be launched.

The Power Query Editor has several tabs that are packed with methods for cleansing, transforming, and adding data. The Home Tab provides ways to manage the columns and rows, parse data in columns, group rows of data, replace values, and more.
A portion of the Transform Tab contains methods for manipulating tables and columns. For example, if you are loading 24 months of budget data that is displayed with 10 accounts on the left and budget amounts pertaining to each month in 24 columns, a method exists to “Unpivot Columns.” This will automatically transform the table from 10 rows x 24 columns to 240 rows x 2 columns (account, amount).

An awesome feature of the Power Query Editor is that it keeps track of your steps in the Applied Steps section of the navigation pane on the right. This allows you to delete or re-order the steps as needed. It also automatically applies the steps each time you refresh the query, eliminating the need to manually select them again.
Data Tools: Power Pivot
After the data is loaded into the Data Model, select the green icon in Data Tools (Go To Power Pivot). Here, exceptional, interactive views of the data can be established.

Once Power Pivot for Excel is open, you can view the data table that was loaded into the Data Model. Note that all the data in the Data Model is stored within the workbook, and will be available to any user who opens it. Also, each data set that has been loaded into the Data Model will appear in a different tab within Power Pivot.

If primary key/foreign key relationships exist between fields in the loaded data sets, those relationships can be established using the Diagram View, much like relationships are established using MS Access. Also, the data is now setup and available to be analyzed with Power Pivot’s Pivot Table. Setting up a Pivot Table with Power Pivot is similar to setting up a regular Pivot Table in Excel, and includes functionality for slicers and conditional formatting.

Contact ExcelHelp.com for a Free Consultation
Let us help you design and develop a rock-solid solution for your firm! Contact our team to schedule a free consultation by calling 1-800-682-0882, or visit our website at ExcelHelp.com to submit an inquiry online.
