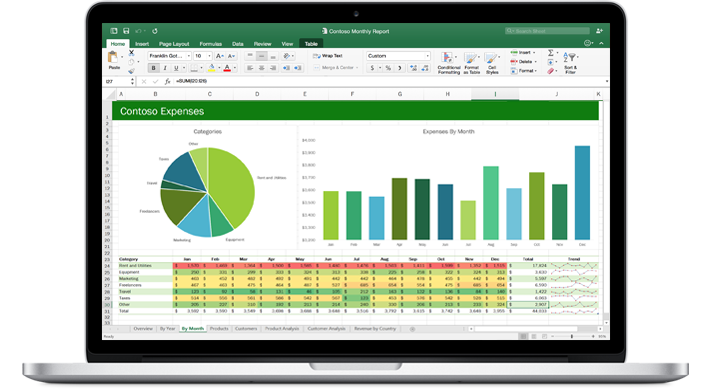
The average management position has become as numbers-driven as finance. Big data is driving more decisions in strategy and development at every level. As a result, Microsoft has been enhancing Excel software to make it more of a data analysis tool for managers who aren’t techies. PowerPivot, one of the most popular add-ons over the past few years, now comes included in Excel 2013 automatically. This is huge.
PowerPivot is a data analysis and visualization tool that can turn the average mid-level manager into a master of statistics and business intelligence with a little training. Anyone who knows how to use a pivot table can now transform a massive amount of data into an interactive report on the state of the business at a very deep level.
Here Are The Top 5 Ways to Use PowerPivot
1. Saying goodbye to VLOOKUP. Comparing data from different tables is a necessary part of business, but it’s not what Excel was designed to do. MS Access is the relational database, while Excel was made for calculating with spreadsheets and generating simple charts. In practice, managers have to crunch numbers from a patchwork of data sources and someone is always asking them to break down numbers by new criteria. One way to do this is to create a bridge between tables with VLOOKUP, which can take forever, slows down the processor and wastes too much memory. PowerPivot is able to relate columns across tables and analyze them instantly, without waste or drag on the system.
2. Extreme compression. Excel can normally handle up to one million rows of data. That’s more than most people need for a spreadsheet, but it means creating lots of tables over time. Now, in-depth analysis using PowerPivot gives you practically no limit to the amount of data you can analyze into a single workbook. Hundreds of millions of rows of data can be condensed into a spreadsheet that fits on your laptop. The entire sales history of a business could be folded up to fit within a PowerPivot table and still scale up as the business grows.
3. Instant Web app. Discovering information that you need is one thing, but sharing has always meant emailing huge files that are immediately out of date. That creates a nightmare for version control and security, which PowerPivot puts to rest. PowerPivot workbooks are self-contained web applications. When you are ready to publish to your internal website, just “Save as…” to convert them into an interactive site. One click provides a comprehensive web report that automatically refreshes its data on whatever schedule you choose. Now, all you have to email or message to partners is a link.
4. Define your KPIs in-house. This is one of the most versatile tools of PowerPivot. To build out KPIs from your data, you have to start with calculated fields. Calculated fields measure values from your spreadsheets in relation to other critical inputs, like a time range, a line of products or geographic region. You can then take those calculated fields and apply low, high and target threshold values. Creating your own KPIs will save thousands of dollars in consulting fees, and the resulting data analysis will justify your budget.
5. Write your own formulas without SQL. Don’t wait for IT to get around to writing your SQL request when they get a break. Write your own calculations with complex formulas using DAX, the Data Analysis Expressions language. Diagram View runs on a drag-and-drop coding model, so you don’t even need to sign up for SQL classes to start managing relationships between the raw data and get answers now.
Customized Excel Development
PowerPivot can become extremely powerful when developed by the right experts. What kind of information would make your life easier? Contact the professionals at e-Software Associates to unlock PowerPivot’s full potential. What you do with your big data can make a big difference.
